Maintenance KPIs: Which Indicators to Track and How to Use Them?
A maintenance manager who walks into a management meeting with a feeling — "we had a lot of breakdowns this month" — doesn't have the same impact as one who presents a preventive/corrective ratio that dropped from 60/40 to 45/55 in three months, correlated with an 18% increase in maintenance costs on the same machines. The first sparks a discussion. The second triggers a decision.
Yet most maintenance teams already collect the data needed to produce these indicators. Every completed task, every recorded activity, every spare part consumed feeds a database. The problem isn't a lack of data — it's a lack of analysis.
The Indicators That Actually Matter
Three families of indicators cover the essentials of maintenance management. Multiplying them beyond that doesn't produce more value — it produces noise.
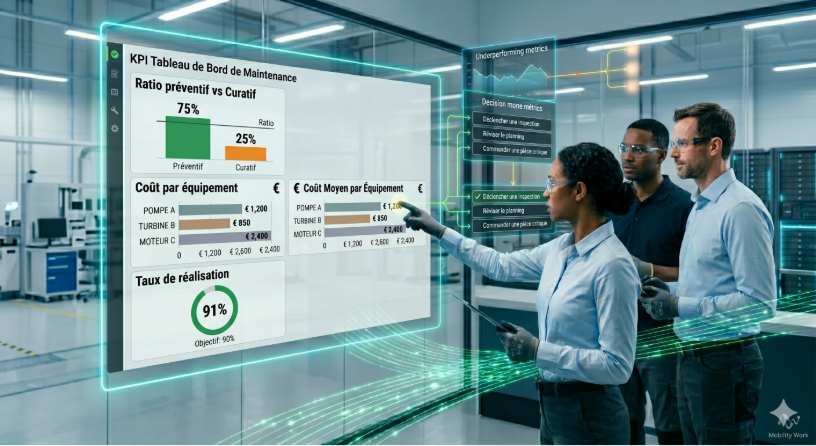
The first family is the preventive/corrective ratio: It's the maturity indicator par excellence. It measures the proportion of preventive tasks relative to corrective tasks over a given period. A ratio that degrades month after month signals a preventive program falling apart — plans not maintained, late tasks accumulating, technicians absorbed by urgency. Conversely, a ratio that improves means the organization is gaining control over reactivity.
The second family is maintenance cost per equipment: Aggregating labor costs, spare parts costs, and additional costs per machine identifies equipment that concentrates expenditure. A machine that costs as much in annual maintenance as its residual value is a candidate for replacement — but without this consolidated data, no one sees it.
The third family is the preventive completion rate: It measures the proportion of preventive tasks completed on time relative to tasks generated by maintenance plans. A low completion rate doesn't mean the preventive program is poorly designed — it often means technicians lack time, plans generate too many simultaneous tasks, or the necessary spare parts aren't available at the right time.
From Raw Data to Decision
The indicator alone isn't enough. What matters is the chain from field data entry to management decision.
This chain starts with data entry quality. If the technician doesn't fill in the duration of the intervention, there's no reliable labor cost calculation. If spare parts aren't declared in the task, there's no stock tracking or cost per equipment. Entry discipline is the prerequisite for any usable indicator.
In Mobility Work, the maintenance manager opens the analytics dashboard and filters expenditure by equipment over the last six months. They identify three machines whose cost has significantly increased. Cross-referencing with the preventive/corrective ratio, they find these machines have shifted toward corrective — preventive tasks were no longer being completed. They adjust maintenance plan frequencies and present the data to management to support their request for additional resources. For teams that need more advanced analysis, the Data Connector enables data export to Power BI or Metabase.
Classic KPI Management Mistakes
The first mistake is tracking too many indicators. A dashboard with twenty KPIs serves no one — it buries the information. Three to five well-chosen indicators, regularly analyzed, have more impact than twenty metrics consulted once per quarter.
The second mistake is measuring without acting. A preventive/corrective ratio that degrades for six months without any maintenance plan being adjusted makes the KPI useless. The indicator must be linked to an action: strengthen a plan, reallocate resources, anticipate a replacement.
Three Actions to Manage Your Performance
- Start with the preventive/corrective ratio: It's the simplest indicator to set up and the most revealing. It requires only one piece of data: distinguishing preventive tasks from corrective tasks — something the CMMS does automatically if your maintenance plans are configured.
- Track maintenance costs per equipment every quarter: Filter by equipment, compare periods, identify trends. Equipment whose cost increases quarter after quarter is the first candidate for a maintenance plan review or a replacement decision.
- Present data in management meetings: The KPI has value only if it's shared. Present the preventive/corrective ratio and costs per equipment once a month. It's the most direct way to transform maintenance from a perceived cost center into a demonstrated performance driver.
Any questions?
Contact us to discover the first CMMS that can be deployed in 3 weeks.