How to reduce your maintenance expenses thanks to CMMS?

Do you want to reduce your maintenance expenses without affecting your productivity or your margins? One of the most effective methods would be to eliminate non-value-added activities, in particular by implementing a CMMS software.
Reduce internal expenses
One of the methods to reduce your maintenance expenses is to avoid wasting your resources, or in other words, to eliminate non-value-added operations. To be relevant, maintenance activities must be carried out that have a positive impact on the reliability of installations.
Analysis of the time spent by type of intervention
Analyzing the relevance of the time spent is more complex to perform than analyzing the effectiveness. To analyze the time of a supervisor's day, it is necessary to analyze the time spent in 5-minute increments taking into account administrative activities, direct interventions, training and non-added value (NVA). The use of the labels of your Mobility Work CMMS software (computer-aided maintenance management) allows you to easily classify your interventions by categories.
An area of progress may be to compare:
- The day observed;
- A typical day according to the supervisor;
- An ideal day according to the supervisor.
Strictly speaking, there is no benchmark. However, it can be argued that in companies that perform well in maintenance, control agents spend more time in proactive supervision.
Qualified and unqualified interventions
With regard to the activities of qualified technicians, it is necessary to analyze improvement interventions, qualified interventions, intervention preparation as well as unqualified interventions. One way of progress may be to compare the distribution Habitual to a more relevant distribution. The more relevant distribution gives ideas for evolution. Unqualified interventions can often be transferred to unqualified or less qualified technicians.
This “freed up” time can be used to carry out missions that only qualified technicians can carry out.
Examples:
- Improving the routines of preventive maintenance in content and frequency;
- FMEA studies;
- Formalization of maintenance procedures;
- Training of unqualified technicians;
- Improvement of production equipment, etc.
Analysis of compliance with maintenance programs
An indispensable element
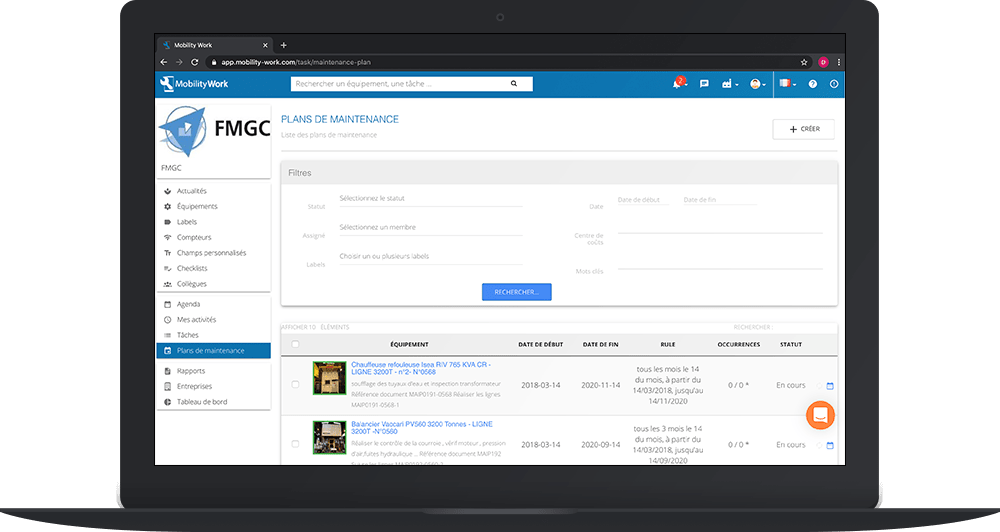
When applied correctly in frequency and content, preventive maintenance programs make it possible to anticipate and then control potential risks. Mobility Work's next-generation CMMS allows any maintenance manager to easily plan these preventive interventions using the calendar tool.
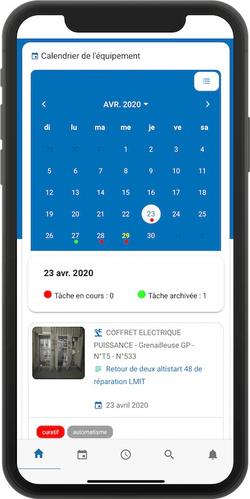
The Mobility Work CMMS mobile calendar supports you in your interventions in the field.
The frequency can vary from half a day to a year, and in some cases even up to several years. What determines this frequency is the associated risk. These may be risks in terms of the reliability of installations but also risks related to security or the environment.
As a result, when the preventive maintenance programs are not fully respected, that means taking a risk. Mobility Work CMMS allows this type of analysis. We systematically compare the planned with the completed.
The rate of compliance with preventive maintenance programs must exceed non-respected programs according to their frequency. Since the analysis covers a full month, it is indeed less critical not to have respected the quarterly programs. However, any failure to comply with programs whose frequency is less than or equal to one month implies a risk for the company.
Origins and causes
In general, non-compliance with preventive maintenance programs can come from:
- An excess of urgent curative interventions leading to an excess of work compared to available resources. In this case, measures must be taken quickly in order to “free up” time. Short-term actions such as value-added/non-value-added analyses can be implemented. With regard to medium and long-term actions, it is possible to carry out actions such as conducting FMEA studies to better anticipate the modes of failure of installations and to change the relevance of preventive programs.
- The perception of the intervener that the frequency of the program is too tight, and that he can safely space it out. It is necessary to analyze the relevance of the frequency and possibly change it.
Analyze the relevance of curative and corrective tasks
This analysis consists in identifying what proportion of the curative and corrective tasks carried out recently could have been avoided by better relevance of maintenance activities. The aim is to ask the managers concerned whether these tasks could have been avoided by:
- A better preventive measure;
- Technical changes or investments;
- Better management of the installations by production personnel.
It is not a question of defining the precise solution to be implemented, but simply of saying to which family of actions the possible solution belongs.
Efficiency for your maintenance department
To be effective, it is a question of optimizing the time required to carry out maintenance activities. The analysis of the added value of interventions consists in supporting maintenance agents for one or several full days in order to:
- To measure the rate of value added/not added value;
- To identify the actions to be taken to increase the rate of added value.
One of the difficulties is to identify value-added and non-value-added activities.
The following are considered value-added activities:
- The time spent by the maintenance agent with his manager to understand the interventions to be carried out;
- Preparing the tools, industrial supplies and equipment required for the intervention;
- Travel from one intervention to another;
- The time spent performing the intervention;
- Writing intervention reports, etc.
The following are considered non-value-added activities:
- The amount of time spent waiting for the day's instructions;
- Wait times between two interventions;
- Return trips to the industrial supply store and the tool store (poor preparation, incidents);
- The time spent repairing or cleaning a tool or a supply that should have been in perfect working order, etc.
The Mobility Work next-generation CMMS analytics tool quickly makes it possible to analyze some of these values and to avoid the maintenance manager wasting time looking for them.
Identification of areas for progress
All that is needed is to conduct an analysis of the distribution of value-added and non-value-added activities as well as the main causes of non-value-added activities. There are two families of ways of progress:
- Those related to the non-added value of the stakeholders;
- Those related to the non-added value of the duration of the intervention.
Quantification of areas for progress
Three methods are possible: binary, statistical, or act of faith quantification. In terms of value-added/non-value-added analysis, the only possible quantifications will be based on an act of faith. It can be considered that over an entire maintenance department, it is rare to exceed 85% of VA. If we find an average rate of 65%, we should set a 6-month goal of 85%.
Analyze your maintenance schedules
This analysis makes it possible to measure the impact of the planning of maintenance activities on the efficiency of the time spent. It can be easily measured with Mobility Work maintenance calendar function.
Of course, a more or less important part of maintenance activities cannot be planned. However, urgent treatment, which is by definition not plannable, represents only a negligible part of operators' time in a successful company. The mission of maintenance is to effectively prevent breakdowns and not to repair them.
The calendar functionality offered by the Mobility Work application allows you to plan all your preventive and predictive maintenance interventions.
Scheduling rate analysis
The calculation formula is:
Scheduling rate = sum of scheduled task hours/total hours available
The ideal planning rate is 100%!
Analysis of the implementation rate of the plan
The rate of completion of the plan gives us the measure of everything that disrupts daily life.
The calculation formula is:
Completion rate = sum of the planned hours of planned and completed tasks/sum of the planned hours of planned tasks
Assessing opportunities to reduce personnel costs
These are “potential” gains whose final reality depends on several conditions:
- These gains can be used to effectively reduce internal headcount, but they can also be used to reduce outsourcing expenses.
- These gains are the result of the implementation of progress actions linked to the development of corresponding good maintenance practices. These gains represent a potential that is not always achievable in the short term. Indeed, the gains associated with better relevance require a longer period of implementation than those related to efficiency.
The assessment process involves three steps:
Step 1: Summarizing the analyses carried out
Analysis results
Benchmark performance
Inferior
averages
Superiors
Observed Value Added Rate
< 65%
65 to 85%
> 85%
Proactive supervision rate
< 10%
10 to 30%
> 30%
Scheduling rate
< 50%
50 to 80%
> 80%
Rate of compliance with preventive programs
< 80%
80 to 95%
> 95%
Rate of curative and corrective maintenance
< 70%
30 to 70%
> 30%
Percentage of preventable healing tasks
< 50%
30 to 50%
> 30%
Time spent by qualified technicians in qualified activities and improvements
< 30%
30 to 60%
> 60%
Step 2: Efficiency gains
It can be considered that the difference between the observed average value added rate and 85% constitutes the potential gain. These gains are all the more realistic as the proactive supervision rate and the planning rate analyzed are low.
Step 3: Relevance gains
Only the activities of preventive maintenance are really relevant. On the other hand, it is also not possible to decree the suppression of curative and corrective activities. The study of preventable curative and corrective tasks makes it possible to define the potential gains associated with a better relevance of maintenance activities.
In fact, the percentage of avoidable tasks represents the gross percentage of reduction in curative and corrective maintenance activities. Avoidable tasks are only preventable in three ways: through more prevention, through technical improvements and through better management of installations.
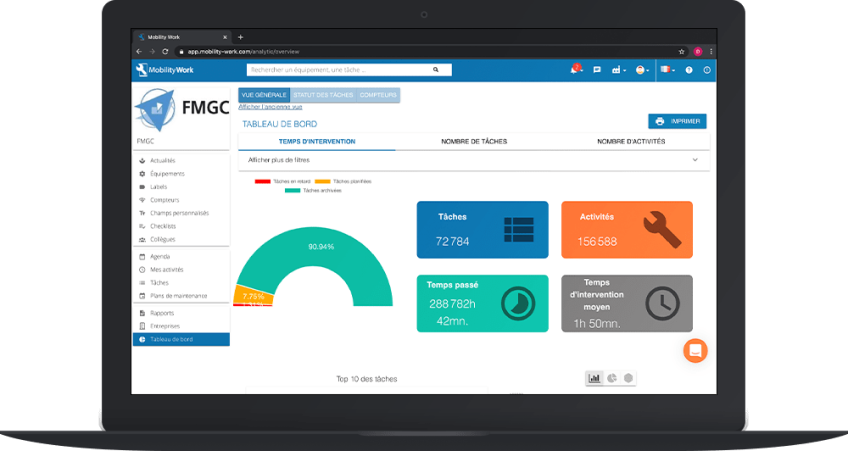
The forecasts of the Mobility Work application analytics tool are based on data collected from thousands of users working on the same equipment.
To conclude, here are some ideas for indicators that you can easily obtain with Mobility Work's analytical tool to measure the relevance and effectiveness of your maintenance service:
Indicators
units
formulas
objectives
Preventive maintenance rate
%
Clocked times in m. preventive/
Total hours clocked
Measures progress in the relevance of maintenance
Number of on-call
number
Number of on-call calls in a given period
Give an idea of the state of emergency of the site and the stress generated
Rate of completion of preventive maintenance programs
%
No. of programs completed
No. of programs planned
Allows you to anticipate future reliability degradations
Indicators
units
formulas
objectives
MTTR (Mean Time to Repair) or TMDR (average repair time)
hrs
Average time elapsed between the moment the failure occurs and the moment it is repaired
Promotes the search for solutions to reduce the duration of failures
Scheduling rate
%
Scheduled hours of scheduled tasks/
Total hours available
Measures and promotes the planning of maintenance activities
Achievement rate
%
Scheduled hours of planned and completed tasks/
Total hours available
Measures and promotes compliance with maintenance schedules
Utilization rate
%
Hours clocked on task/
Available hours
Allows you to verify the proper use of resources and the relevance of the call for subcontracting
Pending charge
days
Sum of the Planned Hours of the tasks waiting to be completed/
Available daily maintenance staff hours
Encourages the elimination of bottlenecks in the work order system
Are you interested in maintenance management and want to know more in order to increase your productivity and save money? Try our CMMS application for free for 7 days, and improve your maintenance management today!
Any questions?
Contact us to discover the first CMMS that can be deployed in 3 weeks.